NFP, CPI and Interest Rate News: Why Charts Move So Fast
Learn what NFP, CPI and interest rate meetings are, why markets react so strongly, and how to handle wide Spread and Slippage during news.
This article was compiled automatically from the sources listed below
If you open an EURUSD or XAUUSD chart during big news, you may have seen candles shoot up or drop within seconds. That happens because investors around the world are reading the same economic numbers at the same time.
This article explains the 3 groups of news that beginners should know: NFP, CPI and interest rates. It also covers how to read the numbers and what to watch out for when trading during news.
What Is NFP?
NFP (Non-Farm Payrolls) is the US non-farm employment figure. It shows how many jobs were added or lost in the past month. It is usually released once a month, often on the first Friday of the month.
The market pays attention because employment reflects the health of the economy. If people have jobs and income, they tend to spend more. This affects inflation and the interest rate decisions of the US central bank (the Fed).
CPI and Inflation
CPI (Consumer Price Index) measures how much the prices of goods and services that ordinary people buy have changed. This makes it a direct measure of inflation.
Inflation matters because most central banks want prices to rise slowly and in a controlled way. If inflation is too high, a central bank may use interest rates to slow the economy down. If inflation is very low, it may ease policy to stimulate the economy. That is why the market watches CPI closely to guess where interest rates may go next.
How Policy Interest Rates Affect the Market
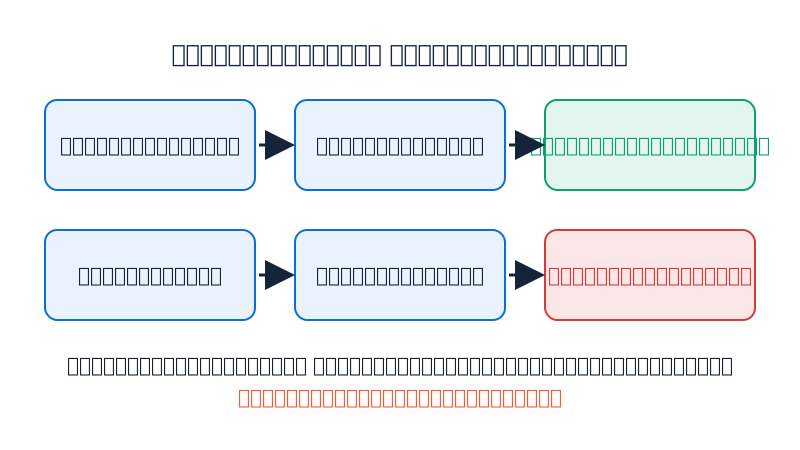
The policy interest rate is the cost of money in the economy. In general, the links work like this:
- Higher interest rates make holding that currency more rewarding. Money may flow in, and the currency often gets support.
- Lower interest rates make holding that currency less rewarding. The currency may weaken.
- Gold pays no interest. When rates are high, holding gold has a higher opportunity cost. But this relationship is not fixed. Gold also depends on the US dollar, global uncertainty and other factors.
Besides the rate itself, the market also listens to the statements and outlook that the central bank communicates. Sometimes the rate decision matches expectations, yet price still moves sharply because of the speaker's tone.
Actual vs Forecast
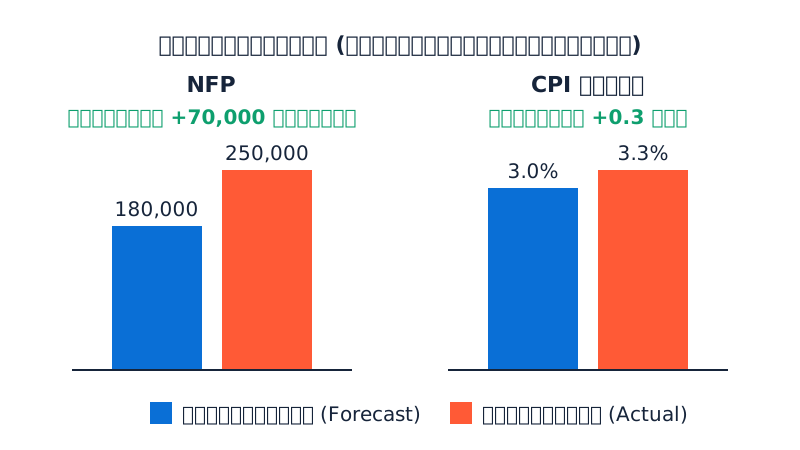
The key to reading news is to compare the Actual number with the Forecast, not to look at the actual number alone. Price often already reflects the market's expectations in advance. What makes price move sharply is the "difference from what was expected," known as a Surprise.
Hypothetical example (the numbers are not real data)
| News | Forecast | Actual | Difference |
|---|---|---|---|
| NFP | 180,000 jobs | 250,000 jobs | +70,000 jobs |
| CPI (yearly) | 3.0% | 3.3% | +0.3 percentage points |
In this example, the jobs figure beat the forecast by 70,000 jobs (250,000 − 180,000), and inflation came in 0.3 points above the forecast (3.3 − 3.0). The market may read this as a strong economy where the Fed may not rush to cut interest rates, which can trigger heavy buying and selling of the US dollar.
But remember that the market does not always react by formula. Sometimes the number matches the forecast and price still moves hard, because the previous month's figure was revised, or because details inside the report, such as wages or core inflation, contradict the headline number. Sometimes price also surges one way and then reverses right away.
Watch Out for Wide Spread and Slippage During News
When news comes out, liquidity often thins briefly. Price providers move their buy and sell prices further apart, which creates two problems that beginners often run into:
- Wide Spread means the gap between the buy price and the sell price is wider than usual, so the cost of opening an order goes up.
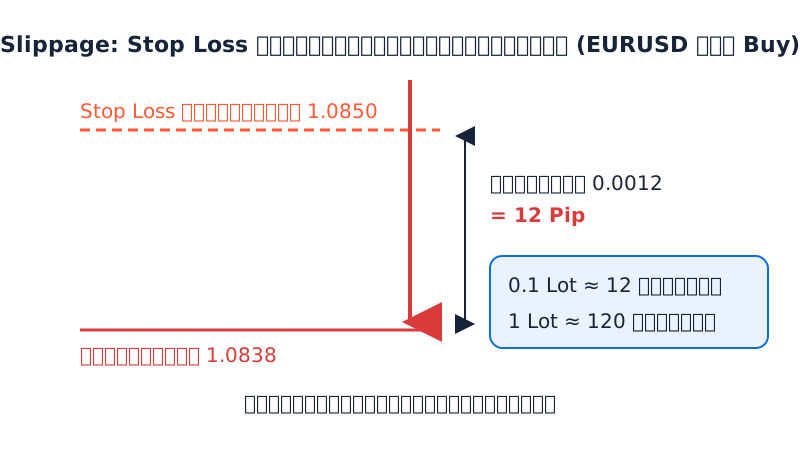
- Slippage means an order is filled at a price different from the one you set. This includes Stop Loss orders you have already placed.
Calculation example: EURUSD, 0.1 Lot (using the approximation 1 Pip ≈ 1 dollar per 0.1 Lot)
- In normal conditions, a Spread of 1 Pip costs ≈ 1 dollar.
- During news, the Spread widens to 10 Pips, costing ≈ 10 dollars. That is 10 times more expensive before you have even started trading.
- You hold a Buy position with a Stop Loss at 1.0850, but price drops sharply and your order is closed at 1.0838. The difference is 0.0012, or 12 Pips worse than planned. That is an extra loss of ≈ 12 dollars, which would be about 120 dollars if you traded 1 Lot.
This means a Stop Loss does not always guarantee that you will be closed at that exact price when the market is extremely volatile.
Make the News Calendar a Habit
Most major news is released on a schedule announced in advance, so you can prepare with an Economic Calendar. Many websites and trading platforms offer one for free.
What to look at in the calendar:
- Date and time. Convert it correctly to Thailand or Laos time, because US time changes with the seasons.
- Importance level. Calendars usually rank news as low, medium or high. Focus on high-impact news first.
- Forecast and Previous values, so you can compare them with the actual number when it is released.
- Related currencies, so you know which of your currency pairs or assets may be affected.
Once you know in advance, you can choose to reduce your position size, avoid opening new orders close to the news time, or simply watch and learn. That last option is a perfectly fine choice for beginners.
Risks and Common Mistakes
- Entering a trade out of fear of missing out. Price that has already moved within a few seconds is usually hard to chase and very risky.
- Using too large a Lot size. High volatility can cause losses faster than expected, especially when using high Leverage.
- Believing a Stop Loss is always safe. As the example above shows, the actual closing price may differ from the one you set.
- Reading news with a fixed formula. For example, thinking that a better-than-expected number must always push price the same way. The market can reverse at any time.
- Forgetting to check the calendar, then holding a position through major news by accident.
- Trading money you cannot afford to lose. Investing carries the risk of loss, and no method guarantees profit.
Summary
NFP shows the state of employment, CPI shows the level of inflation, and interest rates are the central bank's main tool linking the two. To understand news, start by comparing the actual number with the forecast rather than looking at a single number on its own.
For beginners, a good way to build understanding is to open the news calendar every week, write down the forecast and actual numbers, and watch how the chart reacts, all without using real money. And remember that news time is one of the riskiest periods in the market.
Lesson quiz
Score at least 80% to pass this lesson.
According to the article, what usually makes price move sharply when economic news is released?
Why does the market watch CPI closely?
You trade EURUSD with 0.1 Lot (using 1 Pip ≈ 1 dollar per 0.1 Lot). During news the Spread widens from 1 Pip to 10 Pips. About how much does the Spread cost you now, and how does it compare with normal?
You hold a Buy position with a Stop Loss at 1.0850. During extreme volatility, your order is closed at 1.0838. What does this show, and what is the extra loss at 1 Lot (≈ 10 dollars per Pip)?
A beginner sees a better-than-expected NFP number and assumes price must rise right away. What does the article say about this?
Ask the AI tutor about this lesson
Stuck on something? Ask and get a simple answer with examples.