How to Read Candlestick Charts: A Beginner's Guide
Learn how to read candlesticks, from open, close, high and low prices to wicks, colors and timeframes, plus basic patterns like Doji, Pin bar and Engulfing.
This article was compiled automatically from the sources listed below
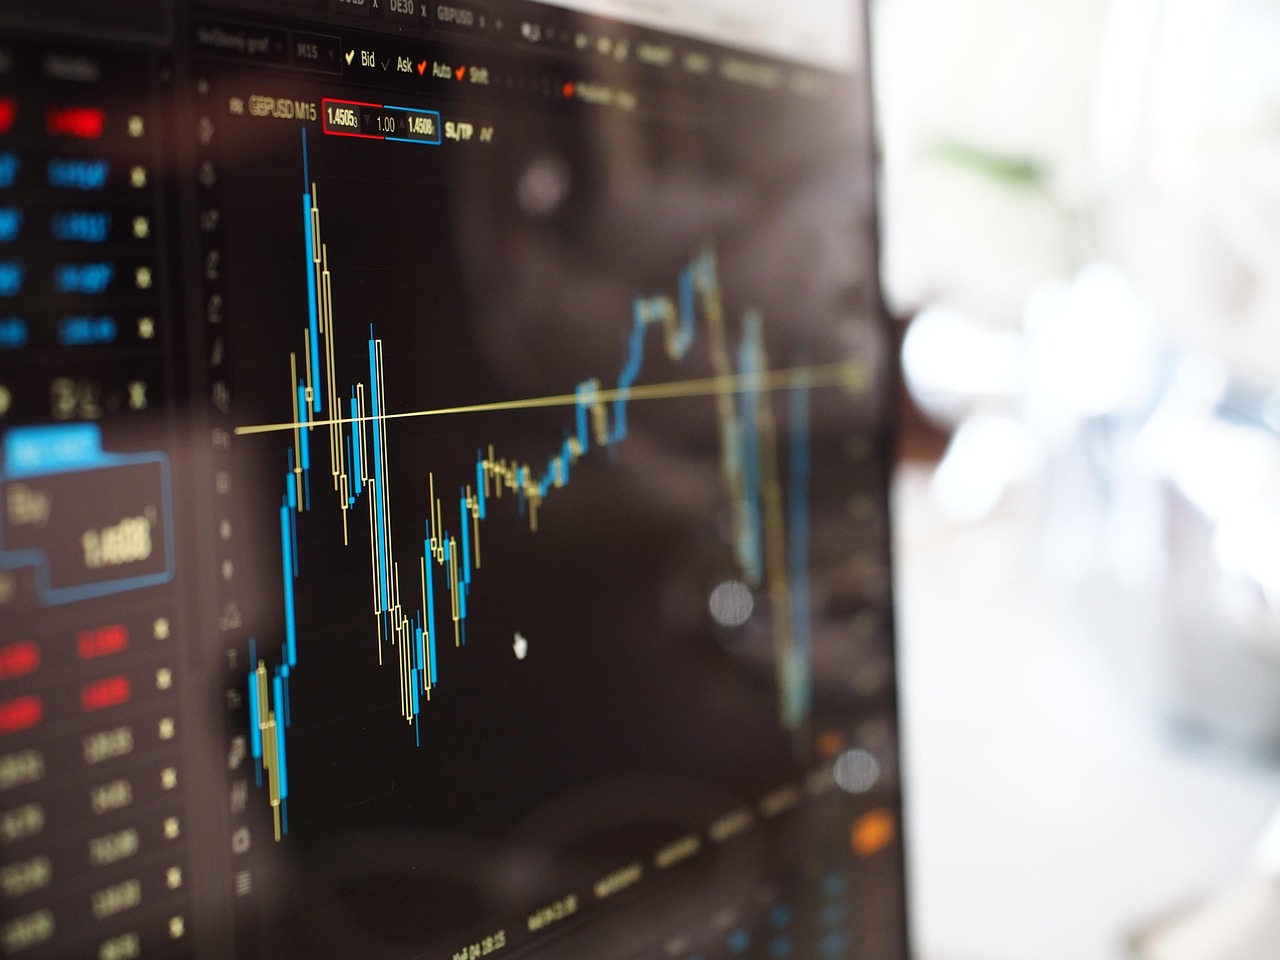
The first time you open a chart of EURUSD, XAUUSD or a stock, you usually see red and green bars lined up across the screen. These bars are called candlesticks. Investors around the world like this chart style because a single candle shows several pieces of price information at once.
This article explains how to read candlesticks step by step, with a worked example using numbers, and introduces 3 basic patterns. The focus is on understanding, not on predicting prices.
What One Candlestick Tells Us
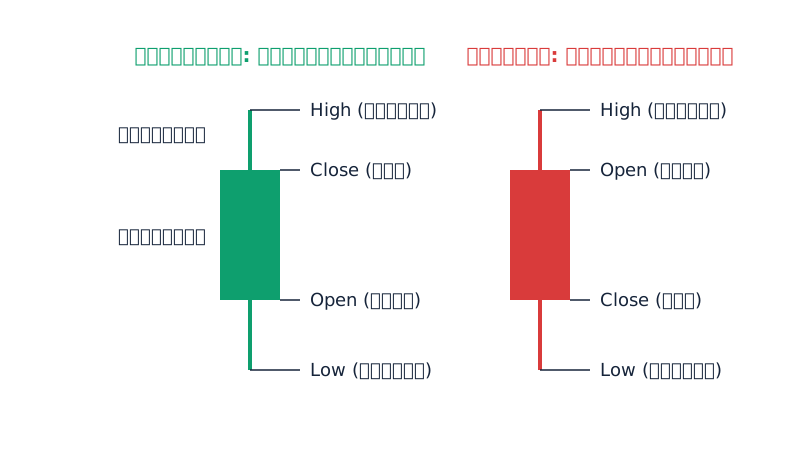
One candlestick summarizes how the price moved during a period of time, such as 1 hour or 1 day. It uses 4 values, known together as OHLC.
- Open: the first price of that period
- High: the highest price reached during that period
- Low: the lowest price reached during that period
- Close: the last price of that period
A candlestick has 2 main parts. The body is the thick part between the open price and the close price. The wick (also called the shadow) is the thin line that reaches up to the highest price and down to the lowest price.
Green Candles and Red Candles
The color of a candle tells you whether the close price was higher or lower than the open price.
- Green candle (bullish candle): The close is higher than the open. The bottom edge of the body is the open price and the top edge is the close price.
- Red candle (bearish candle): The close is lower than the open. The top edge of the body is the open price and the bottom edge is the close price.
Colors can differ between platforms. Some programs use white and black, or reverse the colors so that red means up and green means down. So always check the settings of the chart you are using first.
A long body means the open and close prices are far apart. A short body means the close is near the open.
What Wicks Tell You
A wick shows how far the price went during that period before being pulled back.
- Long upper wick: The price went up high, but closed far below the high.
- Long lower wick: The price went down low, but closed back far above the low.
- No wick or a very short wick: The price closed near the high or the low of that period.
A wick is simply a record of what already happened during that period. It does not tell you where the price will go next.
A Worked Example With Numbers
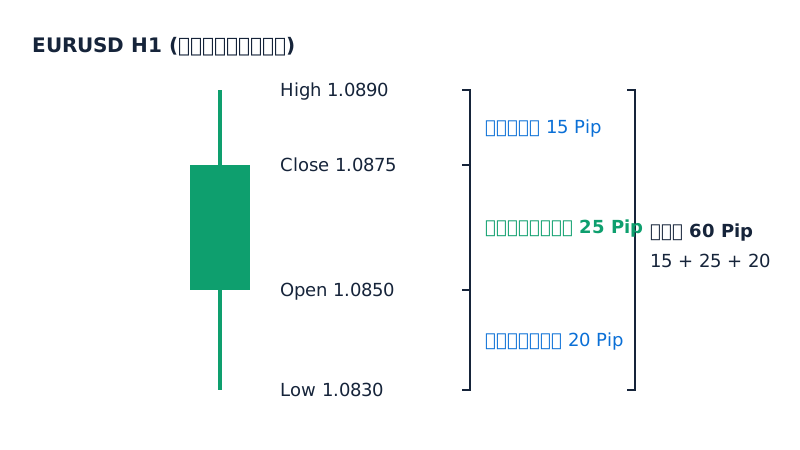
Suppose an H1 candle of EURUSD has the following data (made-up numbers for learning purposes):
- Open = 1.0850
- High = 1.0890
- Low = 1.0830
- Close = 1.0875
Step 1: Check the color. Close (1.0875) is higher than Open (1.0850), so this is a green candle.
Step 2: Measure the body. 1.0875 − 1.0850 = 0.0025, or 25 Pip.
Step 3: Measure the wicks.
- Upper wick = High − Close = 1.0890 − 1.0875 = 0.0015, or 15 Pip
- Lower wick = Open − Low = 1.0850 − 1.0830 = 0.0020, or 20 Pip
Step 4: Check the total range. High − Low = 1.0890 − 1.0830 = 0.0060, or 60 Pip. This matches 25 + 15 + 20 = 60 Pip exactly.
You can read it like this: during that hour, the price dipped 20 Pip below the open, then bounced back to close 25 Pip above the open.
For a red candle, use the same method, but the upper wick is measured from High down to Open, and the lower wick is measured from Close down to Low.
What Is a Timeframe, and Why Does It Matter?
A Timeframe is the length of time that one candlestick represents, for example:
- M1, M5, M15 = 1 minute, 5 minutes, 15 minutes
- H1, H4 = 1 hour, 4 hours
- D1 = 1 day
- W1 = 1 week
The same market can look very different when you change the Timeframe. A big red candle on M5 may be just a small move inside a D1 candle that is turning green.
As a general observation, larger Timeframes have less noise but take longer to play out. Smaller Timeframes show movement faster, but have more false candles. Beginners should try looking at several Timeframes first to understand the big picture.
3 Basic Candlestick Patterns
These patterns are ways people describe price behavior. They are not signals that guarantee the price will follow.
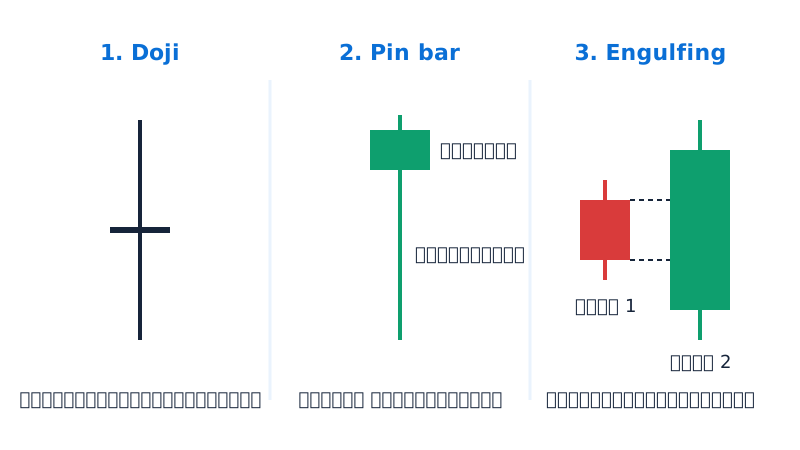
1. Doji
A Doji is a candle where the open and close prices are almost the same. The body is very thin, or almost just a line. The wicks can be long or short.
How to interpret it: During that period, buyers and sellers fought and neither side clearly won. Some people see it as a sign of indecision in the market, but after a Doji the price can go in either direction.
2. Pin bar
A Pin bar is a candle with a long wick on one side and a small body at the other end. Some people use a rough guideline that the wick should be at least 2 times the length of the body, but there is no fixed rule.
How to interpret it: The price was pushed far and then pushed back. For example, a long lower wick means the price dropped deep but was pulled back up. However, if the price keeps moving on, that long wick doesn't help at all, so look at the surrounding context too.
3. Engulfing
Engulfing is a 2-candle pattern. The second candle has a larger body that completely "engulfs" the body of the first candle, and the two candles have opposite colors.
How to interpret it: The latest candle's movement was clearly stronger than the previous one. The size of the candle also depends on the Timeframe and current market conditions, so it does not guarantee that the direction will change.
Risks and Common Mistakes
- Treating candlestick patterns as certain signals: Every pattern has times when the price went as expected and times when it did not.
- Looking at a single candle in isolation: A candle means more when you view it together with previous candles, support and resistance, and the overall trend.
- Looking at only one Timeframe: This can lead you to misread the bigger picture.
- Making decisions from a candle that hasn't closed: A candle that is still moving can change shape at any time, both body and wicks, so wait for the candle to close before analyzing it.
- Forgetting risk management: No matter how well you read charts, trading always carries a chance of loss. Set a Lot size and Stop Loss you can accept, and use only money you can afford to risk.
- Major news causing price jumps: Candles can stretch unusually long and make familiar patterns unusable.
Summary
One candlestick shows the open, high, low and close prices of its period. The color shows the direction between open and close, the body shows the distance, and the wicks show how far the price went. The Timeframe sets your viewpoint. Doji, Pin bar and Engulfing are just ways of describing price behavior, not prediction tools.
Try opening a chart and practicing by reading past candles one at a time. Calculate the body and wick sizes yourself, or practice on a demo account before using real money. This will help you understand the language of charts faster.
This article is for educational purposes only and is not investment advice.
Lesson quiz
Score at least 80% to pass this lesson.
A candlestick on a chart is green (bullish) using the default colors described in the article. What does this tell you?
An H1 candle of a pair has Open = 1.2000, High = 1.2060, Low = 1.1970, Close = 1.2040. What are the body size and the total range (High − Low)?
A candle has a long lower wick and a small body near the top. What does the wick literally tell you, according to the article?
On the M5 Timeframe you see a big red candle. Why might this not be a reason to conclude the market is clearly falling?
Which description best matches an Engulfing pattern and how it should be interpreted?
Ask the AI tutor about this lesson
Stuck on something? Ask and get a simple answer with examples.