Trends and Moving Averages for Beginners
Learn how to spot a trend using higher highs and higher lows, and understand SMA and EMA moving averages, including the 50 and 200 lines and their limits.
This article was compiled automatically from the sources listed below
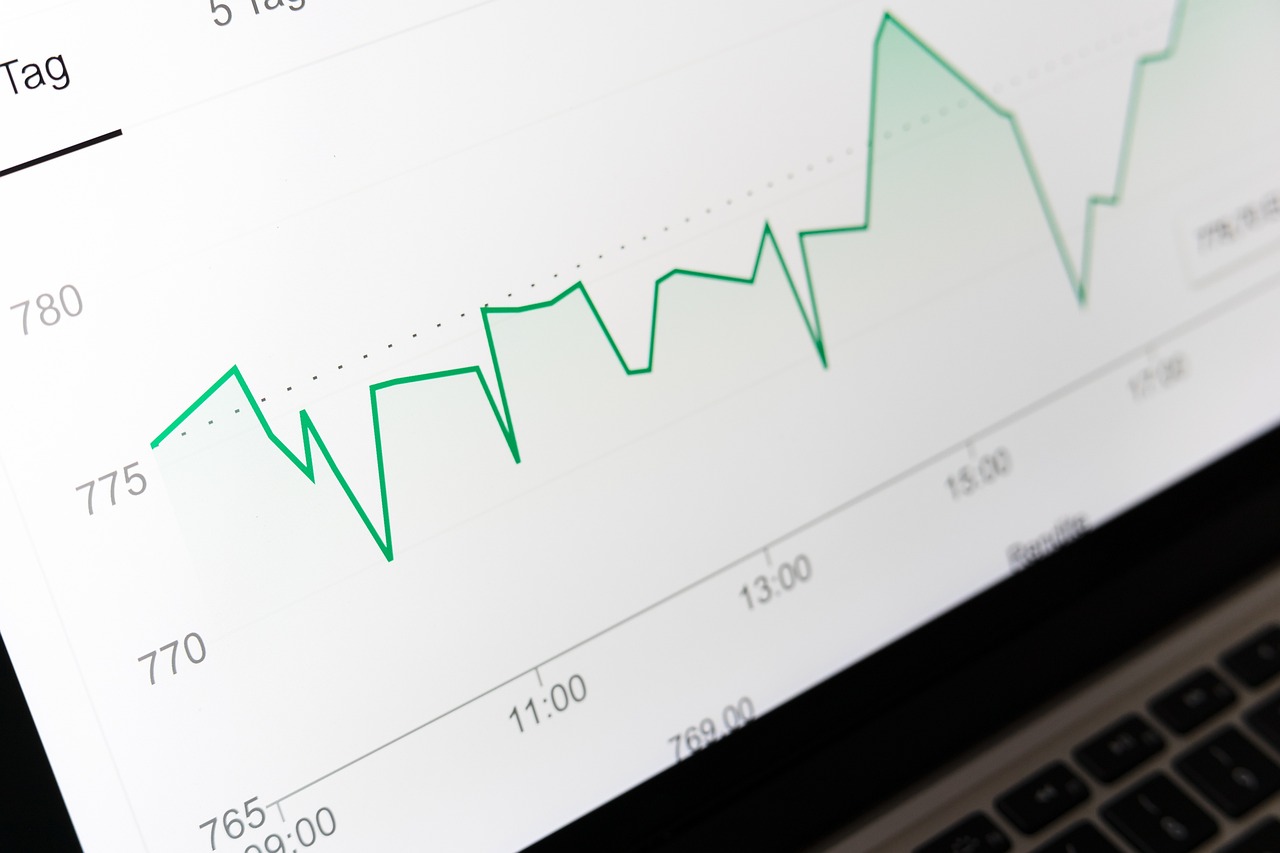
The first time you open a chart, you may see candlesticks moving up and down everywhere and have no idea where to start looking. Two basic tools that make the picture clearer are the Trend and the Moving Average. This article explains both in simple terms, and they work on EURUSD charts, XAUUSD charts, or stock charts.
What Is a Trend?
A trend is the main direction of price over a period of time. It can be split into 3 simple types:
- Uptrend: Price makes a Higher High (HH), meaning a new high that is above the previous high, and a Higher Low (HL), meaning a new low that is above the previous low.
- Downtrend: Price makes a Lower High (LH) and a Lower Low (LL), meaning both the highs and the lows keep getting lower.
- Sideways: Price swings within a narrow range with no clear direction.
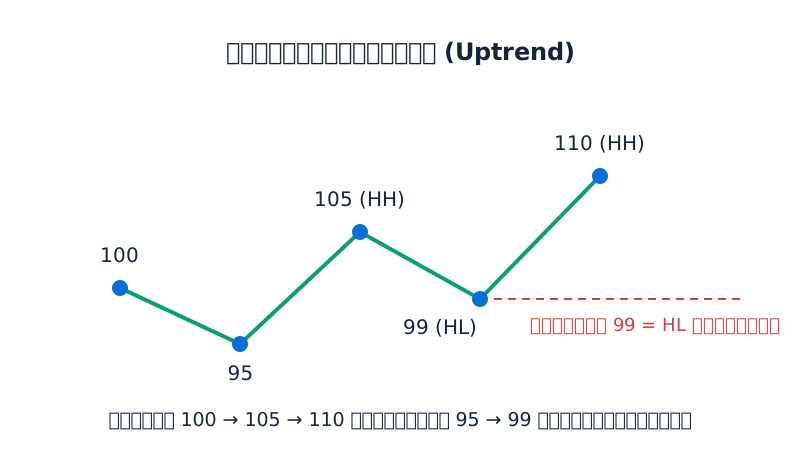
Here is an example of an uptrend. Say price rises to 100, pulls back to 95, rises to 105, pulls back to 99, and then rises again to 110. In this case the highs are 100 → 105 → 110 and the lows are 95 → 99, and both are rising. This is called an uptrend structure. But if price pulls back below 99, the Higher Low has been broken and the structure starts to change.
What Is a Moving Average?
A Moving Average (MA) is a line made by taking a set number of past closing prices, finding their average, and connecting those averages into a line on the chart. When a new candlestick forms, the average moves forward (which is why it is called "moving"). The result is a line that is smoother than the actual price, filtering out small ups and downs so the overall direction is easier to see.
The number you set is called the "period." For example, MA 20 is the average of the last 20 closing prices. The larger the period, the smoother the line and the slower it reacts. The smaller the period, the faster the line follows price.
What Is the Difference Between SMA and EMA?
SMA (Simple Moving Average) is the plain average. Every candle in the chosen period has equal weight.
EMA (Exponential Moving Average) gives more weight to recent prices than to older ones. This makes the line react to price changes faster than an SMA with the same period.
SMA 5 Calculation Example
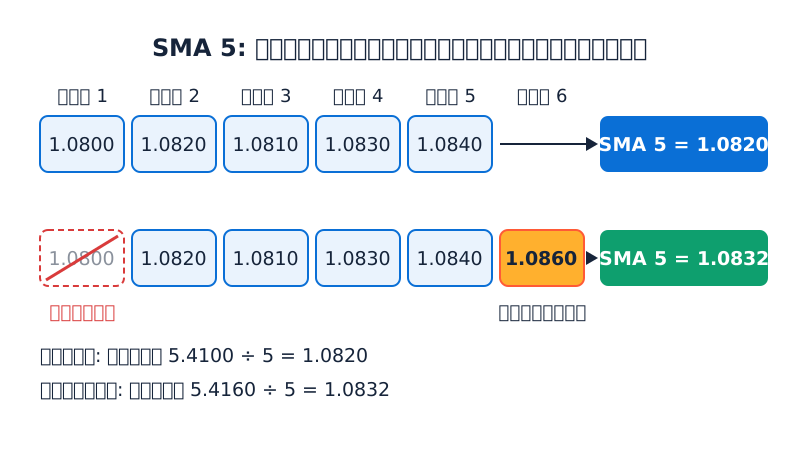
Suppose the closing prices for the first 5 days of EURUSD are as follows (made-up numbers for teaching):
1.0800, 1.0820, 1.0810, 1.0830, 1.0840
- Sum = 1.0800 + 1.0820 + 1.0810 + 1.0830 + 1.0840 = 5.4100
- SMA 5 = 5.4100 ÷ 5 = 1.0820
On day 6, price closes at 1.0860. Drop the first day (1.0800) and add the new price:
- New sum = 1.0820 + 1.0810 + 1.0830 + 1.0840 + 1.0860 = 5.4160
- New SMA 5 = 5.4160 ÷ 5 = 1.0832
The line moved from 1.0820 to 1.0832 as price went higher.
EMA 5 Calculation Example
The formula uses a multiplier k = 2 ÷ (period + 1), so k = 2 ÷ 6 ≈ 0.3333
Today's EMA = (today's closing price − yesterday's EMA) × k + yesterday's EMA
If we use a starting value of 1.0820 (usually an SMA is used as the starting point) and the day 6 close is 1.0860:
- Difference = 1.0860 − 1.0820 = 0.0040
- 0.0040 × 0.3333 ≈ 0.0013
- EMA 5 = 1.0820 + 0.0013 = 1.0833
In this example the values are very close. The difference with EMA shows up more clearly when price moves strongly and steadily, because EMA gives more importance to recent prices. Charting software calculates all of this for you automatically, so as a beginner it is enough to understand the idea.
The 50 and 200 Lines People Often Mention
MA 50 and MA 200 are periods that analysts commonly use. On a daily chart (D1), they are generally seen like this:
- MA 50 represents the medium-term trend.
- MA 200 represents the long-term trend.
Basic ways to read them:
- Price is above the line and the line points up: this usually matches an uptrend picture.
- Price is below the line and the line points down: this usually matches a downtrend picture.
- The line is flat and price often crosses above and below it: this is usually a sideways period.
Some people call the moment when MA 50 crosses above MA 200 a Golden Cross, and when it crosses below, a Death Cross. But these are just names for patterns on the chart. They do not mean price must go in any particular direction next.
Limitations of Indicators Like the Moving Average
- Always lags behind price (Lagging): An MA is calculated from past data, so it tells you what has already happened and does not predict the future.
- Easily misleading in a sideways market: Price crosses the line back and forth many times, creating inconsistent signals (Whipsaw).
- Results differ by period and timeframe: MA 50 on a 5-minute chart and on a daily chart give completely different pictures.
- There is no "best" value: A number that works well for one asset during one period may not suit another period or another asset.
- It does not know about news or new events: Price can jump instantly on major news before the line has had time to adjust.
Risks and Common Mistakes
- Putting on too many MAs: The chart gets cluttered, is hard to interpret, and the lines often contradict each other.
- Using a line crossover as the only signal without looking at price structure, such as HH/HL, and other context.
- Changing the period back and forth until it fits the past: This tunes it to old data and does not guarantee future results.
- Not setting your risk: Whatever tool you use, always plan your Lot size and Stop Loss first, because every trade can result in a loss.
- Trading with money you can't afford to lose: This adds emotional pressure.
Summary
A trend helps you see which direction price is heading overall. Look for Higher High/Higher Low in an uptrend and Lower High/Lower Low in a downtrend. A Moving Average helps smooth that picture and makes it easier to read. SMA gives equal weight to every candle, while EMA is faster because it emphasizes recent prices. The 50 and 200 lines are popular numbers for viewing the medium and long term.
Try opening a practice chart or a demo account, add one MA at a time, and watch how the line reacts to price during trends and sideways periods. You will understand both its strengths and its limits much better.
This article is educational content and is not investment advice.
Lesson quiz
Score at least 80% to pass this lesson.
According to the article, which pattern describes a downtrend?
Price rises to 100, pulls back to 95, rises to 105, pulls back to 99, then rises to 110. Which later move would break the Higher Low and start to change the uptrend structure?
The last 3 daily closes on a chart are 1.2000, 1.2030 and 1.2060, so SMA 3 = 1.2030. The next day closes at 1.2090. What is the new SMA 3?
Why does an EMA 20 usually react to price changes faster than an SMA 20?
A trader sees MA 50 cross above MA 200 (a Golden Cross). What does the article say about this?
Ask the AI tutor about this lesson
Stuck on something? Ask and get a simple answer with examples.