What Are Support and Resistance? How to Find Them, With Examples
Learn what support and resistance mean, how to find them as zones on a chart, how support turns into resistance, where to place a Stop Loss, and common mistakes.
This article was compiled automatically from the sources listed below

When you open a chart of EURUSD, XAUUSD or a stock, you may notice that the price often stops or bounces back at the same levels again and again. Traders call these levels support and resistance, and they are among the most basic ideas in technical analysis.
What Are Support and Resistance?
- Support is a price level where the price has fallen to in the past and buyers stepped in, so the price stopped falling or bounced up. Think of it as a floor that holds the price up.
- Resistance is a price level where the price has risen to in the past and sellers stepped in, so the price stopped rising or pulled back. Think of it as a ceiling that holds the price down.
These levels work because many buyers and sellers remember the same prices. For example, someone who bought and is now at a loss may wait to sell when the price returns to their entry price. But keep in mind that this is a "tendency that has happened before," not a rule that guarantees the price will stop there every time.
A Zone, Not a Single Line
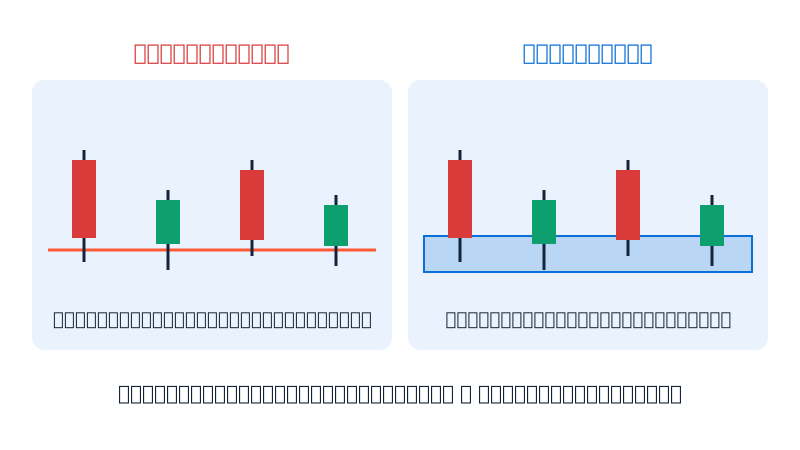
Many beginners draw one thin line at an exact price, then are surprised when the price breaks through a little and comes back. In reality, support and resistance are better seen as a zone, a band of prices with some width.
This is because the buy and sell orders of many people are not placed at exactly the same price, and candle wicks often poke slightly through a line. A simple way to draw a zone is:
- Find the points where the price has turned around several times.
- Look at both the lowest point of the wicks and the closing prices of the candles in that area.
- Draw a rectangle around those points instead of a single line.
How to Find Support and Resistance
1. Previous turning points (Swing High / Swing Low) Look for clear peaks and troughs on the chart. A peak where the price rose and then fell back is a possible resistance. A trough where the price fell and then bounced is a possible support.
2. Number of touches The more times the price tests the same zone and turns around, the more the market notices that zone. But if it is tested very often, the zone can weaken and eventually break.
3. Round numbers Prices such as 1.1000 in EURUSD or 2,000 in XAUUSD are levels many people pay special attention to, so they are often used as psychological support and resistance.
4. Look at several timeframes A zone that is clear on the daily (D1) or weekly (W1) chart is usually more important than one on a 5-minute chart. Start with the bigger timeframe, then zoom in to the smaller ones.
5. Combine with other tools For example, a Moving Average or the previous day's high and low can help you check whether the zone you found matches the levels other people are watching.
When Support Becomes Resistance (and the Other Way Around)
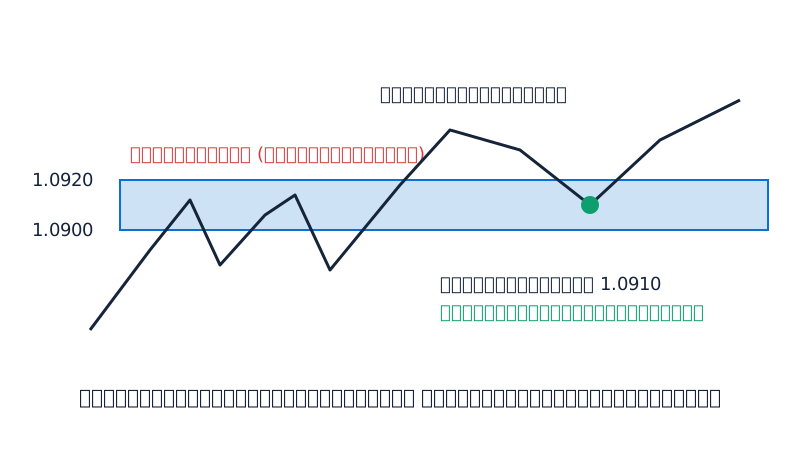
A very important idea is that when the price clearly breaks below support, that old zone often becomes new resistance when the price comes back up to test it. In the opposite case, when the price breaks above resistance, the old zone may become new support.
The psychological reason is that people who bought in that zone and are now at a loss often want to sell when the price returns near their entry price. So selling pressure comes from the same place. Meanwhile, people who missed the move may wait to enter when the price comes back to test the level.
Example of the idea: suppose EURUSD was held down at the 1.0900–1.0920 zone several times. One day the price closes clearly above this zone. If the price later pulls back to around 1.0910, an analyst would watch whether this zone acts as support. But that does not mean it must bounce every time. Sometimes the price falls back through it again.
Example: Using a Zone to Place a Stop Loss, With Calculations
The numbers below are made up for learning only and are not advice to buy or sell.
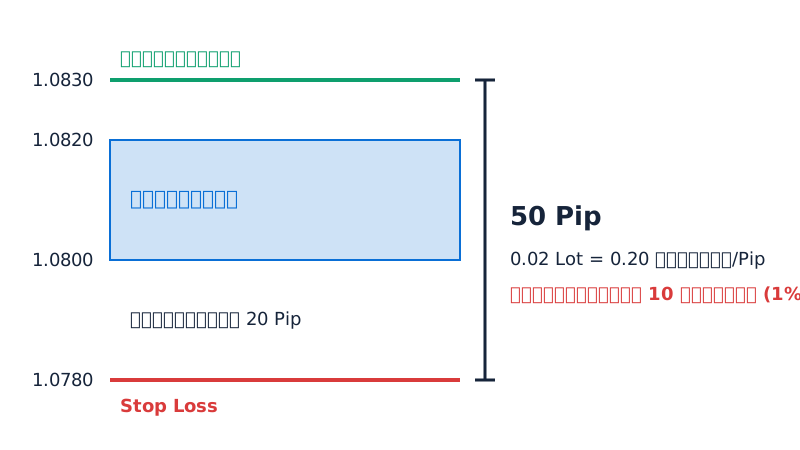
Suppose EURUSD has a support zone at 1.0800–1.0820. The price has touched this zone several times, and the lowest wick point is at 1.0800. A trader plans to buy at 1.0830 and has 1,000 US dollars in the account. The trader decides to risk no more than 1% per trade, which is 10 dollars.
Step 1: Decide the Stop Loss level If the Stop Loss is placed exactly at 1.0800, a wick could easily hit it. So it is placed 20 Pip below the zone, at 1.0780. If the price falls that far, it means the expected support zone has failed.
Step 2: Calculate the Stop Loss distance 1.0830 − 1.0780 = 0.0050, or 50 Pip
Step 3: Calculate the Lot size
- For EURUSD, 1 standard Lot is worth about 10 dollars per Pip
- 0.01 Lot is worth 0.10 dollars per Pip
- 0.02 Lot is worth 0.20 dollars per Pip
If you use 0.02 Lot, the maximum loss when the Stop Loss is hit = 50 Pip × 0.20 = 10 dollars, which is exactly 1% of the account.
You can see that support and resistance give us a clear "point where the idea is wrong," and then we calculate the position size to match the risk we can accept. We do not pick the position size first and then guess where to cut the loss.
Risks and Common Mistakes
- Drawing a single line that is too exact. This leads to misreading when the price pokes through slightly. Use a zone instead.
- Drawing too many lines. The chart fills up with lines and you can't tell which ones matter. Choose only the clear zones from larger timeframes.
- Believing the price must bounce every time. Support and resistance are just areas where a reaction is more likely, not guarantees.
- Placing the Stop Loss too close to the zone. A wick can knock you out, and then the price goes in the direction you expected. Leave enough room for the volatility of that asset.
- Not waiting for confirmation of a breakout. A single wick poking through does not mean a real break (Fake Breakout). Some people also look at the candle's closing price.
- Refusing to accept that the zone has failed. If the price breaks the zone you planned around, follow your plan and cut the loss. Do not keep moving your Stop Loss further away.
- Ignoring the news. Around major news releases, the price can rush through zones and Slippage can happen.
Trading involves the risk of loss, especially when using Leverage. Practice on a demo account first, and only use money you can afford to risk.
Summary
Support and resistance are price levels where the market has reacted before. See them as zones rather than single lines. When a zone is broken, its role can flip, and zones can also help you set a Stop Loss in a logical way. To start practicing, open a daily chart, find clear turning points, draw zones, and watch how the price reacts. Keep notes on both the times it worked and the times it didn't, and your understanding of this tool will grow deeper over time.
Lesson quiz
Score at least 80% to pass this lesson.
Why does the article suggest drawing support and resistance as a zone instead of a single thin line?
EURUSD was held down at the 1.0900–1.0920 zone several times, then closed clearly above it. What might an analyst expect when the price pulls back to about 1.0910?
A trader buys EURUSD at 1.0830 and places the Stop Loss at 1.0780. Using about 10 dollars per Pip for 1 standard Lot, what is the maximum loss if the trader uses 0.02 Lot and the Stop Loss is hit?
According to the article, what is the correct order for managing risk using a support zone?
Which of the following would the article say makes a support or resistance zone more important?
Ask the AI tutor about this lesson
Stuck on something? Ask and get a simple answer with examples.