What Is Risk:Reward? Why You Can Profit Winning Less Than Half
Understand the 1:2 Risk:Reward ratio and the minimum win rate that avoids a loss, with a 10-trade example calculated step by step.
This article was compiled automatically from the sources listed below

Many beginners think you have to be right more than half the time to make money trading. In reality, long-term results don't depend only on how often you win. They also depend on how much you make when you win and how much you lose when you lose. This is the heart of Risk:Reward.
What Is Risk:Reward?
Risk:Reward (RR) is a ratio that compares the risk you accept with the reward you hope to earn on a single trade.
- Risk is the distance from your entry point to your Stop Loss
- Reward is the distance from your entry point to your Take Profit
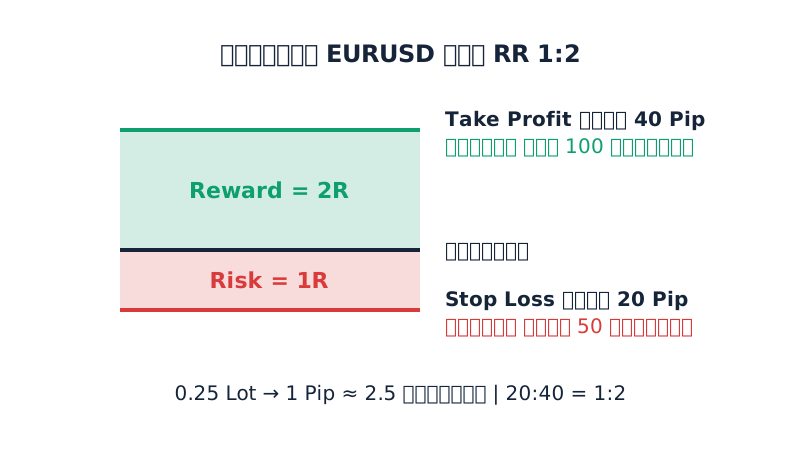
If your Stop Loss is 20 Pip away and your Take Profit is 40 Pip away, the ratio is 20:40, or 1:2. This means that if you win, you earn 2 times what you lose when you lose.
We often call one unit of risk 1R. So an RR of 1:2 means you lose at most 1R but aim to gain 2R.
Example: Setting a 1:2 RR on a Trade
Suppose you have a $5,000 account and decide to risk no more than 1% per trade, which equals $50.
You trade EURUSD with a Stop Loss of 20 Pip and a Take Profit of 40 Pip.
- The value of 1 Pip for 1 standard Lot in EURUSD is about $10
- If you open 0.25 Lot, 1 Pip ≈ $2.50
- If the Stop Loss is hit: 20 × 2.5 = you lose $50
- If the Take Profit is hit: 40 × 2.5 = you gain $100
The Lot size is calculated from the amount you are willing to lose, not chosen by gut feeling.
The Win Rate You Need to Avoid a Loss
Win rate is the percentage of your trades that win. The break-even point comes from this formula:
Break-even win rate = 1 ÷ (1 + the reward side of the RR)
If the RR is 1:2, use 2:
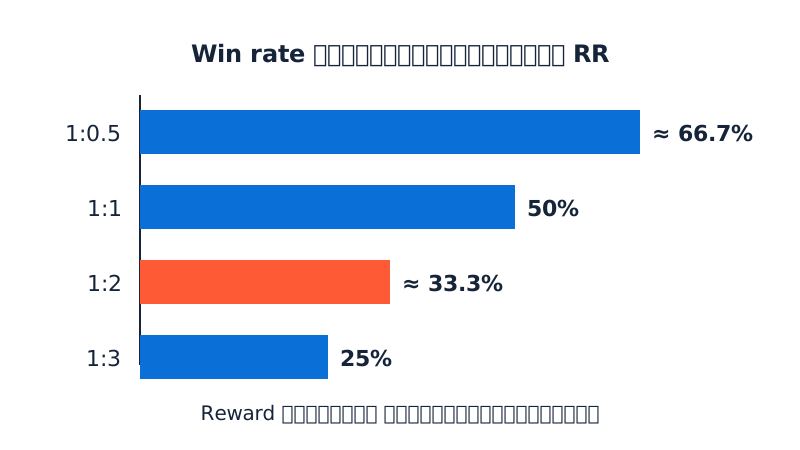
1 ÷ (1 + 2) = 1 ÷ 3 ≈ 33.3%
This means that if you trade with a 1:2 RR and win about 1 in 3 trades, your overall result will be roughly break-even (before fees). If you win more than that, your overall result starts to turn positive.
Here is a comparison of different RRs:
| Risk:Reward | Break-even win rate |
|---|---|
| 1:0.5 | ≈ 66.7% |
| 1:1 | 50% |
| 1:2 | ≈ 33.3% |
| 1:3 | 25% |
You can see that the bigger the Reward compared with the Risk, the less often you need to win. And if the RR is below 1:1, you need to win very often just to avoid a loss.
A 10-Trade Example
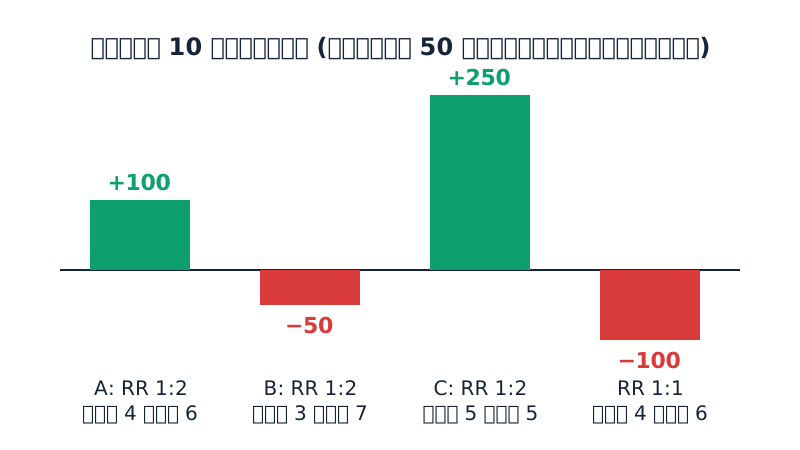
We'll use the same numbers: risk $50 per trade and an RR of 1:2 (a win earns $100).
Case A: 4 wins, 6 losses (40% win rate)
- Wins: 4 × 100 = +400
- Losses: 6 × 50 = −300
- Total: +$100
Case B: 3 wins, 7 losses (30% win rate)
- Wins: 3 × 100 = +300
- Losses: 7 × 50 = −350
- Total: −$50
Case C: 5 wins, 5 losses (50% win rate)
- Wins: 5 × 100 = +500
- Losses: 5 × 50 = −250
- Total: +$250
Now compare with an RR of 1:1 and the same 4 wins and 6 losses as Case A: wins are 4 × 50 = +200 and losses are 6 × 50 = −300, for a total of −$100. The win rate is the same, but the result is different because the RR is different.
Another View: Expectancy
The expected value per trade (Expectancy) is calculated like this:
(Win rate × Reward) − (Loss rate × Risk)
For Case A, using R units: (0.4 × 2R) − (0.6 × 1R) = 0.8R − 0.6R = +0.2R per trade
Over 10 trades, that is 0.2R × 10 = 2R. Since 1R equals $50, the result is $100, matching the calculation above.
A positive expectancy means that, mathematically, if the win rate and RR you use match reality over the long run, your overall results will lean positive. It does not guarantee a profit in every period.
Risks and Common Mistakes
- The 10-trade example is just an illustration. In real trading, results can swing a lot. For example, you can lose several trades in a row even if your system has a positive expectancy.
- Setting a high RR without checking whether it's realistic. Placing a Take Profit very far away makes it harder for price to reach it, and your real win rate may fall below the break-even point.
- Moving your Stop Loss away as price gets close. This makes your real Risk bigger than planned and throws off the whole RR.
- Forgetting costs. Spread, commission and slippage make the real break-even win rate higher than the formula shows.
- Using a Lot size that doesn't match your Stop Loss. If the Lot is too large, just a few losses can seriously damage your capital.
- Not recording your results. If you don't keep statistics, you won't know what your real win rate and RR are.
Summary
Risk:Reward helps you see that trading isn't judged only by "how many times you win." At an RR of 1:2, the break-even win rate is about 33.3%, so you can avoid a loss even when you win less than half the time. But this takes discipline in setting your Stop Loss, calculating your Lot and recording your real results. Try practicing the calculations on a demo account first, so you understand your own numbers before using real money.
Lesson quiz
Score at least 80% to pass this lesson.
A trader sets a Stop Loss 30 Pip from entry and a Take Profit 60 Pip from entry. What is the Risk:Reward ratio, and what does it mean?
According to the article, what is the break-even win rate for a trade setup with an RR of 1:3?
A trader has a $5,000 account, risks 1% per trade ($50), and uses a Stop Loss of 20 Pip on EURUSD, where 1 Pip for 1 standard Lot is about $10. Which Lot size matches this risk?
A trader uses a 1:2 RR, risks $50 per trade, and has 3 wins and 7 losses in 10 trades. What is the total result, and why?
Why can two traders with the same 40% win rate end up with different results over 10 trades?
Ask the AI tutor about this lesson
Stuck on something? Ask and get a simple answer with examples.